Nondestructive testing (NDT) techniques used to evaluate concrete structures include visual inspections, Schmidt hammers, infrared thermography, ultrasonic testing, and ground-penetrating radar (GPR) among others. Ultrasonic testing is a widely used and effective nondestructive technique to evaluate concrete structures’ thickness, and embedded objects such as rebars, technical pipes and tendon ducts. Ultrasonic testing can also be used to detect voids, cracks, delamination and estimate deterioration severity in concrete structures. In addition, this technique can be helpful in providing information regarding the material properties such as concrete strength by measuring the ultrasonic wave velocity.
The longitudinal wave velocity (Vp) in concrete is related to Modulus of Elasticity (E), mass density (r), and Poisson’s Ratio (n) according to the following relationship:

Repeated testing of the longitudinal wave velocity at the same positions, as per ASTM standard [1], can monitor changes in the condition of concrete over time. A decrease in ultrasonic wave velocity over time indicates damage onset before visible deficiencies appear, allowing engineers and inspectors to implement repair recommendations before minor deficiencies become safety hazards. By monitoring ultrasonic wave velocity and strength, it is also possible to predict either directly or indirectly the deterioration caused by carbonation, chloride attack, and freeze-thaw damage to some extent, thus preventing the propagation of corrosion, spalling, and crack initiation in the early stages of the structure’s life cycle [2][3].
The efficiency of the Elop Insight (EI) ultrasonic scanner makes it possible to conduct scans quickly and collect data across large areas, which is especially useful for large-scale infrastructure projects. By providing a detailed condition of the concrete surface and identifying any defects, the EI scanner can help prevent costly repairs and improve the overall safety of the structure. Even though EI scanner is an inspection tool rather than a monitoring tool, its ability to calculate the velocity distribution across the surface in a single scan allows for more accurate and efficient monitoring of changes in the concrete’s condition over time, making it an essential device for maintenance and inspection of structures.
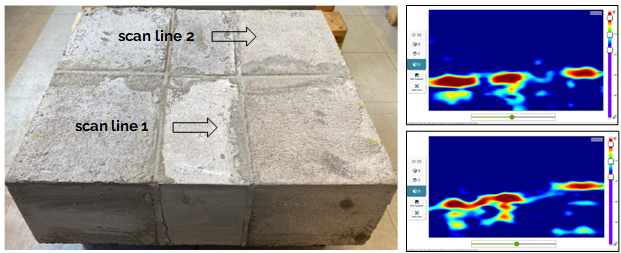
To evaluate the effectiveness of the EI scanner in mapping ultrasonic wave velocity and strength, laboratory sample of concrete with varying grades are prepared as shown in Figure 1 below.

Figure 1: Concrete specimen prepared with six varying qualities/grades (left) with D-scans obtained by using EI scanner (right) at the center line for two scan lines shown in the figure. The concrete quality is controlled by varying the parameters such as aggregate size, grade, cement type, water-cement ratio among others. The variations in the backwall echo for various sections along the scan line shows the change in longitudinal velocity of different concrete grades used in the specimen.
In the current version of our software, a single value for longitudinal wave velocity value is provided to the end user. Being a rolling ultrasound scanner, EI has the flexibility to sample up to 64 values at down to each two millimeters along track spacing. The value shown currently is an average of the values obtained over a scan length of at least 20 cm. To utilize the feature of the rolling system, we are now planning on mapping the velocity for a complete scan area together with 3D SAFT images. This is very useful when we want to check the quality of the concrete over a large area.
As we have already known from (1), the longitudinal velocity (Vp) of the concrete is directly related to its strength (Modulus of elasticity). The higher the velocity, the stronger the concrete is, provided the other material parameters remains the same. For a sound concrete structure, Vp ranges from 3500 m/s to 4500 m/s [4]. If we get the values for density and Poisson’s ratio, we can get the value for strength of the concrete as well. But thanks to the bistatic geometry of EI scanner, we will also get Rayleigh waves (surface waves) in addition to longitudinal waves. We have already utilized the generated surface wave for velocity estimation. Though it won’t be an exact value for longitudinal wave velocity, it would be a good starting value for a scan. A more accurate value can be estimated using the backwall echo from the concrete if the thickness of the concrete is known. The Rayleigh wave (VR) is related to E and n according to the following relationship:

By calculating the values for VR and Vp using equations (1) and (2), we can estimate the strength of the concrete more accurately, especially for the cases where thickness of the concrete is known.

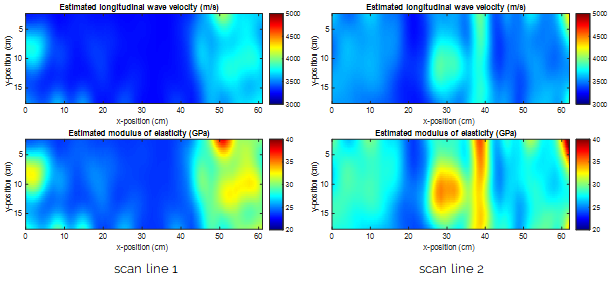
Figure 2; Longitudinal velocity (m/s) mapping of the scan lines for the concrete specimen shown in Figure 1 together with estimated modulus of elasticity (GPa) for both scan lines. The estimated strength and velocity maps fitted closely to the recipes used for various grades used in the specimen. The discontinuities (blue vertical lines) around x-position 20 cm and 45 cm are (most prominent on scan line 2) are caused by poor surface coupling/poor bonding in the interface between the different mixes of concrete (cf. the sample image in Figure 1).
References
[1] Standard Test Method for Pulse Velocity Through Concrete, ASTM (American Society of Testing Materials) C597
[2] Molero, M., Aparicio, S., Al-Assadi, G., Casati, M. J., Hernández, M. G., & Anaya, J. J. (2012). Evaluation of freeze–thaw damage in concrete by ultrasonic imaging. Ndt & E International, 52, 86-94.
[3] Pham, S. T. (2014). Effects of carbonation on the microporosity and macro properties of Portland cement mortar CEM I. Journal of Materials Science and Chemical Engineering, 2014.
[4] Lee, Y. H., & Oh, T. (2016). The measurement of P-, S-, and R-wave velocities to evaluate the condition of reinforced and prestressed concrete slabs. Advances in Materials Science and Engineering, 2016.


