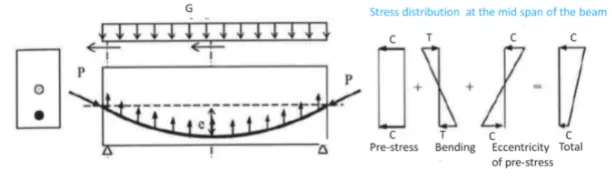
Post-tensioning/Pre-tensioning is a method of reinforcing concrete structures by stretching steel tendons and anchoring hence compressive forces are introduced into an element to reduce tensile stresses and hence, cracks. Post-tension tendon ducts are commonly used in long-span structures However, voids in the grout inside the tendon ducts can occur, which contribute to the loss in total pre/post-tensioned force Pmax. Anchorage zones (Figure 1) are also needed to inspect properly for cracks. Force is concentrated over a small area at the end faces of the member, this leads to high‐tensile forces at a right angle to the direction of compressive forces. There can be cracking in this area due to bursting tensile forces.
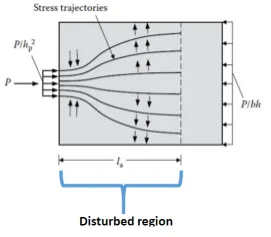
Figure 1: Anchorage zones
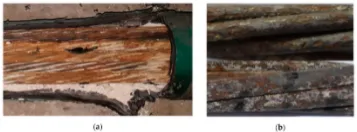
Observed corroded strands in existing brigdes: (a) corroded tendon; (b) corroded strands.
Chung-Ang University, Seoul 06974, Korea
Due to these voids, the losses are calculated/assumed, which is of great importance in the structural analysis afterward to calculate equivalent forces hence verifying the moment and shear capacities to resist the design loads hence certifying the safety of the structure, and further remedial measures if needed.
So, it is important to detect voids and defects in the tendon ducts to ensure the strength and safety of the structure. NDT methods such as ultrasonic testing are commonly used to monitor such structures during operation to prevent failure and increase their lifespan as ultrasonic testing is the most accurate method for detecting air pockets, voids, cracks, and delamination. This is because of a strong reflection from the concrete-air interface due to a large acoustic impedance mismatch.
A test was set up using Elop Insight to detect voids in tendon ducts. A concrete specimen is manufactured with two corrugated steel tendon ducts positioned at about 8 cm from the top surface with dimensions of the specimen being 70 cm in length, 55 cm in width, and 25 cm in thickness and an average aggregate size of 22 mm. The diameter of the tendon duct used is about 10.5 cm. One of the tendon ducts is completely empty while another one is half-length fully filled with grout along the prestressing steel and the other half is only three-quarters filled leaving an air cavity on the top as shown in the figure 2 below.
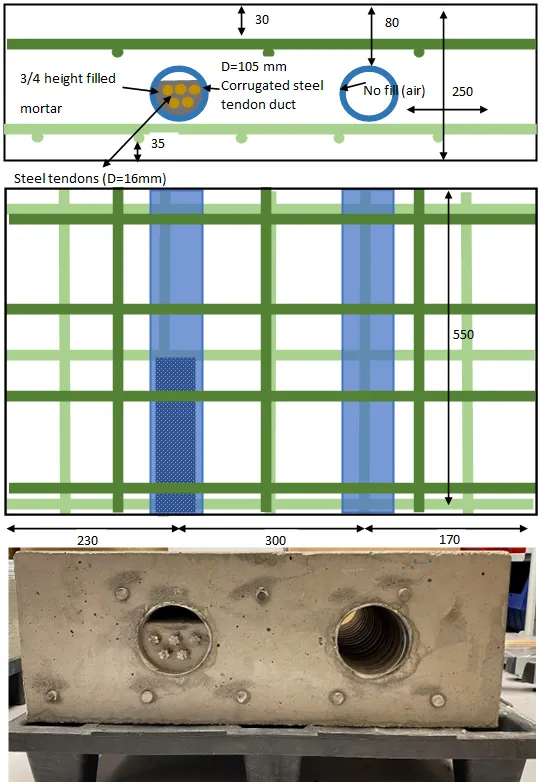
Figure 2: Features of the concrete specimen with hollow and filled tendon duct of Ø 105 mm.
Elop Insight (EI) scanner is used to evaluate its ability to detect grouting defects inside tendon ducts in concrete structures. The scanner is rolled over the surface of the concrete specimen and 3D volume images with tomographic SAFT images are generated at different locations. The results show that the EI scanner is able to differentiate between filled and partially filled tendon ducts inside the concrete.
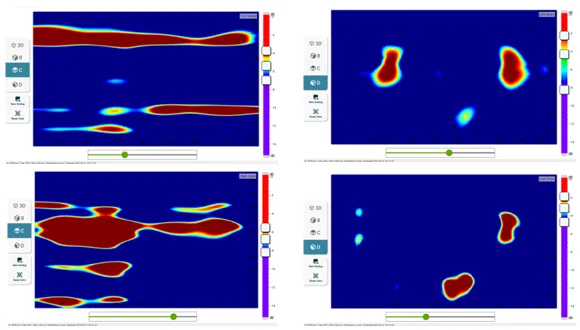
Figure 3: Selected slices from 3D volumetric data for a laboratory specimen with filled, unfilled and partially filled tendon ducts.
C-scan and D-scan images of the concrete specimen for different slices are shown in the figure 3 above. The air-filled part of the tendon ducts can easily be seen as two strong reflectors starting at approximately 8 cm depth in the D-scan cross-section shown in the top right corner of figure 1. While in the bottom right figure, the left fully grouted duct has a considerably weaker reflection. In both scans, a partial back wall can be seen at approximately 25 cm depth where which is not shadowed by the above features. The difference between the fully grouted and air-filled tendon ducts can more easily be seen in the C-scan view taken at approximately 10 cm from the top surface, where the empty duct can be seen as a strong reflector going across the full width at the top of the image. For the partially filled duct across the lower part of the C-scan, we see almost as strong reflections from the right half where we have a cavity, while the left, fully grouted, half has a considerably weaker reflection. Note also that the reflections from the tendon ducts are disturbed by the presence of rebars at about 15 cm and 30 cm.
In the current work, we have prepared concrete specimens with fabricated grouting defects (voids) in tendon ducts and managed to detect them successfully by comparing the amplitude of reflected signals. One more important feature of EI scanner is that it will produce similar results while scanning along the duct as well as in the perpendicular direction of the ducts. This makes the EI scanner highly efficient in the field where one can follow the tendon ducts using the EI scanner and look for areas with stronger reflections to indicate air voids present inside. Detection of such voids, if present, is of great importance as corrosion would be more likely to start from such areas.
Read more about the inspection of tendon ducts using the Elop Insight scanner in the article “Ultrasonic measurements of grouted tendon ducts in the concrete structure using Elop Insight Scanner”