White paper
Seeing beneath the surface
A performance comparison of non-destructive technologies for concrete inspection
White paper by:
Sanat Wagle, PhD, Elop AS
Kamal Raj Chapagain, PhD, Elop AS
December, 2020
Introduction
Bridges, tunnels, buildings - concrete structures are everywhere around us, and we need to monitor them closely to secure their structural integrity. Critical infrastructures made of reinforced concrete have to be inspected regularly to assess how they need to be maintained, to ensure they are safe, to extend their lifetime, reduce cost and not least to minimize their environmental footprint.
With the inspection techniques available today, the maintenance and inspection of such structures takes a large amount of time. Hence, the operators need a quick, precise, and easy NDT technique for safe and smooth handling of these operations.
To meet this need Elop has developed a new and ground-breaking ultrasound measuring device, the Elop Insight scanner. Compared to conventional sub-surface inspection technologies the Elop Insight scanner can see more accurately beneath the surface of concrete structures, and it enhances precision in spotting for instance air pockets, cracks, rebars, and delaminations. In addition to this, Elop Insight is more than 10 times faster than conventional scanning techniques.
When the operator rolls the scanner across the concrete surface it captures data, which are merged in real-time into 3D-images providing a coherent visualisation of the structure beneath it. This allows for immediate interpretation and identification. Furthermore, the data produced by the Elop Insight scanner - images, 3D-video and documentation - are stored in the system and made available to stakeholders through a cloud interface platform.
However, this whitepaper does not focus on speed, 3D-images, or cloud interfaces. It offers an insight into the fundamental capabilities of Elop Insight, its performance, accuracy, and not least repeatability of the measurements performed by it.
Test set-up
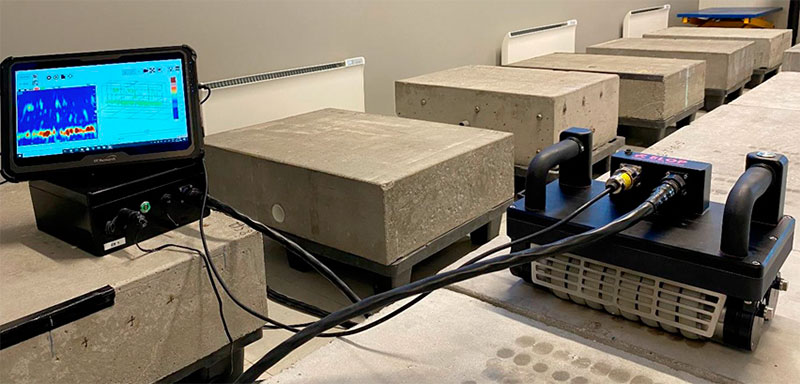
The following pages summarize the results of a number of tests and comparisons, carried out at Elop's R&D facility in Hamar, Norway. To compare the performance of different nondestructive inspection technologies we have used 10 concrete specimens, each with different characteristics, for example concrete mix ratio, density, and thickness of rebars, cracks, air pockets, delamination, drilled holes and tendon ducts.
Measurements have been performed with four different instruments: Impact echo, UPV, Ultrasound Tomography, and Elop Insight scanner, to compare the capabilities of the Elop Insight scanner to these technologies. Also, the test measures the repeatability of the Elop Insight scanner under the same measurement conditions.
Test results
Ultrasonic velocity measurement of concrete
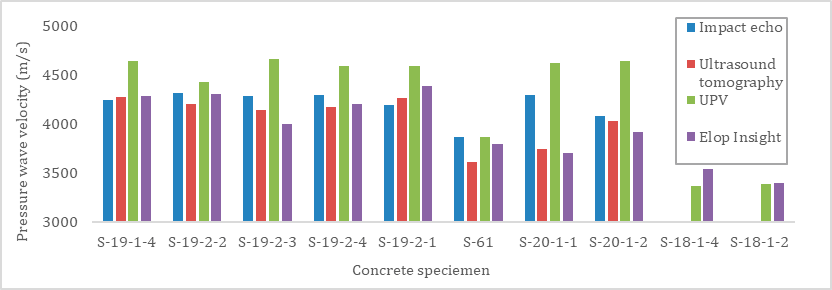
The ultrasonic velocity of the concrete is an indirect measurement of strength of the concrete. For a good quality concrete, the pressure wave velocity should be in the range 3500 - 4500 m/s. However, the ultrasonic velocity of concrete depends upon the aggregate sizes, amount of rebars and concrete mix ratio.
The ten different concrete specimens at Elop's premises were used for velocity measurement with four different instruments. As we can see from the figure, the pressure wave velocities measured from different techniques are very close within 5-10%. The results obtained from UPV are generally slightly higher than obtained by other equipment. The impact echo was not giving correct values when it was measured on the surface above rebars. The obtained velocities from Elop Insight were also verified by the backwall location from 3D images generated by Elop Insight.
Comparison of Elop Insight scan images with Ultrasound tomography
The different concrete specimens were also used for ultrasonic measurement with Elop Insight and Ultrasound tomography scanner to explore the different features such as rebar, air tube, tendon duct and drilled hole inside the specimen. The Elop Insight scanner was rolled about 60 cm with a scanning interval of 0.1 cm. The operating frequency used was 100 kHz.
The Ultrasound tomography scanner was also used approximately at the same location to get B-Scan images for comparison. Each specimen image is compared and some of the representative results are explained below.
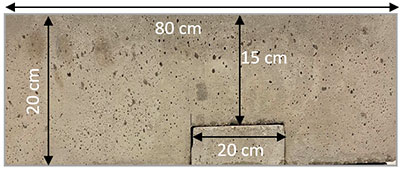
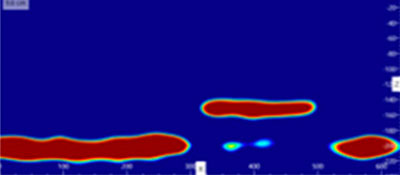
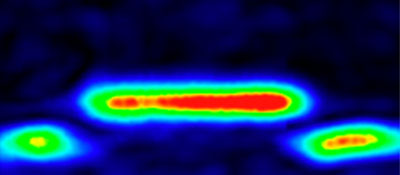
Figure 3: Concrete specimen S-18-1-4 has a delamination of area 20 cm x 60 cm at 15 cm from the top surface. The reflection from delamination around 15 cm is clearly visible together with back-wall echo at 20 cm in both images.
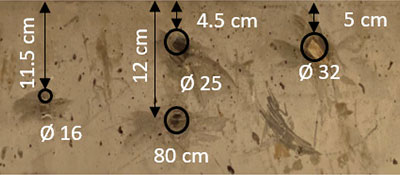
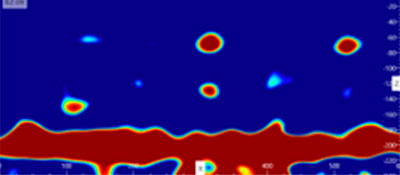
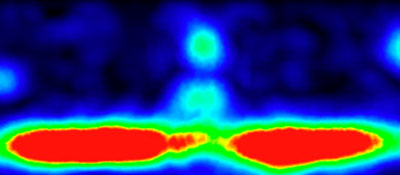
Figure 4: Concrete specimen S-19-1-4 has four rebars with diameters 16 mm, 25 mm and 32 mm at different locations. Clear reflections for all rebars are visible along with the backwall.
Comparison of Elop Insight scan images with GPR
The different concrete specimens were also used for ultrasonic measurement with Elop Insight and GPR to explore features such as rebar, air tube, tendon duct and drilled hole inside the specimen. Each specimen image is compared and some of the representative results are explained below.
For GPR, the delamination was not clearly visible in the first comparison. In the second comparison both images show the tendon duct, but in practical applications it is important to detect the voids in the tendon duct where the ultrasound scanner performs much better than the GPR counterpart.
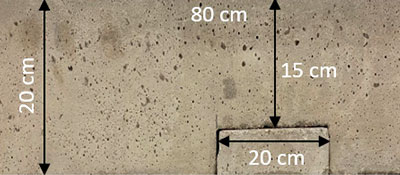
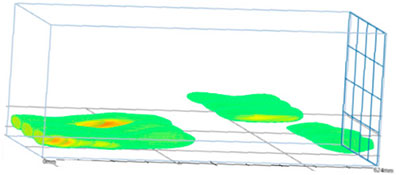
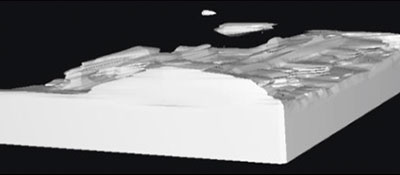
Figure 5: The delamination gap between two concrete slabs is less than 5 mm. The delamination is clearly visible in Elop Insight, while it is not clearly visible for GPR.
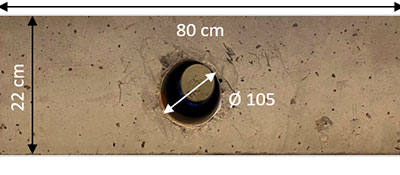

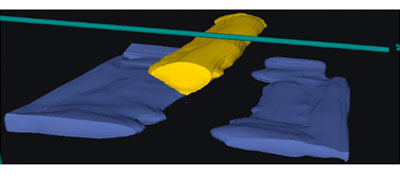
Figure 6: The reflection from tendon duct around 8 cm is clearly visible together with back-wall echo at 22 cm in both images, but the ultrasound scanner performs much better for void detection.
Repeatability of Elop Insight
For testing repeatability of Elop Insight, the concrete specimens were scanned along the same scan line ten times. The setting for transmitter pulse voltage, receiver analog gain, and applied pressure were kept the same for all measurements. The scanner was also rolled at a constant speed.
While analyzing the image, the threshold for the 2D and 3D image was also kept the same and D-scan slices at central plane were chosen for comparison for all ten measurements. Both the drilled hole and the rebar are clearly visible along with the backwall echo in all D-scan images. The results are repeatable with minor variations in noise and artifact.
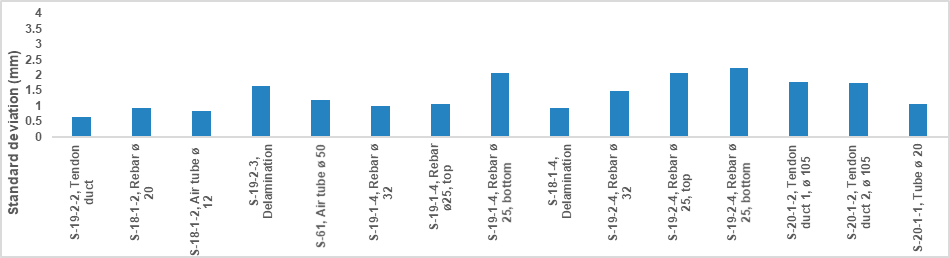
From all the measurements in each of the concrete specimen, the position of the feature and reflector is calculated. The deviation in position from average is within plus or minus 5 mm for all concrete specimens and the standard deviation was found to be within 2.5 mm for all features and concrete specimens.
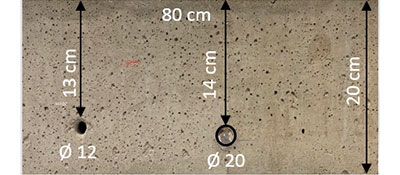
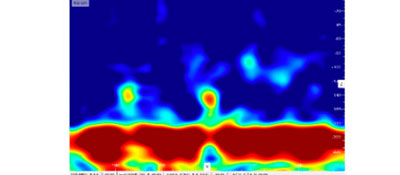
Figure 7: Concrete specimen S-18-1-2 has a rebar and a drilled hole. Both are clearly visible along with the backwall echo in all D-scan images.
Summary
The pressure wave velocities measured from Elop Insight are within 5-10% range to that of different equipment and techniques. Elop Insight was able to detect and locate the features and defects such as air tube, delamination, voids in tendon duct and rebars inside the concrete structure. The images obtained from Elop Insight are similar to that of Ultrasound tomography. However, Elop Insight, being a rolling device, is much more efficient while scanning a large area.
Moreover, Elop Insight is able to produce real-time 3D images whereas for the Ultrasound tomography, data need to be postprocessed in PC to generate the 3D images. Elop Insight was stronger in air and delamination detection compared to GPR. The GPR scanner was stronger in rebar detection compared to Elop Insight. The GPR was also able to detect big air tubes and delamination, but was not able to detect a sub-cm delamination.
The measurements from Elop Insight were repeatable with minor deviations in position for features and reflectors in the concrete specimen. Based on a total evaluation of the B, C, D scans and 3D images, the features and reflectors were clearly visible in all the measurements except for some variations in scattering noise and artifacts.
Putting the Elop scanner into perspective
As this whitepaper proves, the patented Elop Insight ultrasonic scanner provides unique sub-surface images of concrete structures. However, we have combined these capabilities with other features, which as a whole have the potential to revolutionize the inspection of critical infrastructure.
For one thing, the device produces 3D-images and thus delivers a coherent view of the concrete structure being inspected. The scanner offers a real-time 3D view of the subsurface, and the images are easy to read and immediately actionable.
Scanning speed is another of Elop's crucial features. With the ability of going up to 50 cm a second, the Elop scanner is more than 10 times faster than conventional scanning techniques. This means it has the potential to transform concrete inspection from the current state, being mainly reactive, towards a more proactive approach.
With inspection becoming faster and easier, concrete structures can be inspected more often, which will lead to detecting flaws and weaknesses earlier, and ultimately making maintenance more efficient and cheaper.
However, for scanner data to really become valuable it has to be easily accessible for various stakeholders in a coherent manner. The Elop ecosystem collects and stores 3D inspection data, produced on-site and presents it via a cloud platform. Different asset management stakeholders can then work with the data in a standardized way, making collaboration much easier.
Also, the Elop cloud platform enables asset owners to share data and collaborate easier than before with inspection companies, contractors, consultancy companies and certifying bodies.
On top of that, Elop is developing a Structural Health Monitoring system, which integrates a number of data sources related to the deterioration of concrete structures over time, for instance weather data and traffic data.
Furthermore, looking at Elop from a sustainability perspective, developing technology to take optimal care of concrete structures makes perfect sense. Concrete is the most extensively used construction material worldwide, and the concrete production process accounts for 8% of the world's CO2 emissions. The environment benefits from extending the lifetime of concrete structures.
Request demo
Want to learn more about Elop Insight and how the scanner supports concrete inspection workflows?